Experienced graduate student from Rutgers University with a passion for exploring datasets and making data-driven decisions and building solutions. Proficient in Data Analysis, Python, SQL, and JavaScript, with skills in software engineering, data engineering, visualization, and statistical analysis.
July 2024 - Current
• Developed and maintained executive-level reports and dashboards using Tableau and Power BI to monitor and enhance business performance.
• Collaborated with cross-functional teams to design, implement, and maintain data models, enabling seamless workflow automation, data analysis, and reporting.
• Streamlined and created end-to-end workflows for time series analysis and forecasting using SQL, Alteryx and Python, uncovering detailed temporal patterns and perform root cause analysis to solve complex business challenges efficiently.
Sept 2023 - June 2024
Maintained Git repositories for code enhancements, ensuring data pipeline integrity and model reproducibility.
Enhanced data visualization using React, HTML, and CSS, improving user interaction with analytical insights.
Collaborated on backend development using Python, Django, and PostgreSQL to enhance system functionality.
Revised data retrieval and processing for accelerated platform performance and quicker insights.
Engaged cross-functional teams, aligning project goals with data-driven solutions by identifying data requirements and offering technical guidance.
Sept 2022 - May 2023
• Leveraged SQL to query cloud-hosted databases and developed machine learning models using Python and R.
• Utilized version control systems such as Git to manage codebase changes effectively, allowing for efficient collaboration with team members and tracking of development iterations. • Enhanced performance and scalability of data infrastructure to efficiently handle increasing data volumes and meet evolving business requirements.
• Employed Python to build efficient visualizations, including custom Decision Tree and Random Forest Estimators.
• Optimized web application efficiency and accelerated plot generation by 30% through a custom Pruning Algorithm.
• Implemented and managed MySQL databases on AWS and Digital Ocean, ensuring seamless operations for machine learning model deployment.
Programming and optimizing Machine Learning and Data Science models using Python, H2O, Scikit-learn, and custom implementation of Decision Tree and Random Forest Estimator for generating visualizations from any given dataset efficiently.
Developing and streamlining end-to-end flexible web UI mechanism in JavaScript, HTML5, and CSS3, to explore any data set (with some data sets containing 2+ million records) dynamically without the need for code.
Creating and standardizing visualizations that provided essential trends and insights about the datasets to aid in Exploratory Data Analysis and saves critical time during the design phase of building Machine Learning projects.
Hands on lab sessions teaching R and reviewed and graded assignments and exams for more than 50 students across Data science course.
• Analyzed data sets with more than 50 million-line items generating visualizations and insights, identifying outlier, prediction the trends and custom reports assisting in auditing priority clients.
• Incorporated Computer Science, Modelling, Statistics, ETL, Data Science and Machine Learning algorithms to innovate and develop tools which increased the efficacy and functionality of processes.
• Won the spotlight award for contribution to the project EY DIGI BRAT which secured an international level development funding and won the EY Lighthouse project award from EMEIA (Europe, Middle East, India, and Africa) region.
Feb 22 - Apr 22
• Optimized cross modal representation learning in food for problems such as image captioning, visual question answering.
• Built Residual Learning for Image Recognition using residual neural network(ResNet) which efficiently extracted features from images. Streamlined BERT for WordPiece tokenization.
• Trained Canonical Correlation Analysis (CCA) model on the extracted features of the training text-image pairs and used ablation studies for analyzing the improved performance.
Feb 22 - Apr 22
• Created a website that provides information about the traffic accidents in USA.
• Implemented plots using D3.js and Plotly, while the front-end is developed in HTML/CSS using DASH and deployed through Flask.
• Incorporated time series plots and used unsupervised machine learning algorithms to analyze and find insights from the data.
Dec 21
We implemented a Density-based spatial clustering of applications with a noise (DBSCAN) algorithm.
● Given a set of points in some space, it groups together points that are closely packed together; points that lie alone in low-density regions are marked as outliers. DBSCAN is one of the most common clustering algorithms.
● We have done the working of the algorithm with a sample data set of customers in a mall.
● We have used a novel approach to show the working of the algorithm using animation on a website front-end.
Sep 21 - Dec 21
In this project, we are exploring a variant of the infamous A star path finding algorithm using artificial intelligence techniques for an unknown grid world maze.
Jul 19 -Mar 21
Technologies used: Alteryx, Python, Tableau.
EY Digi BRAT - Bank Reconciliation and Anomaly detection Tool reconciles Bank Statement transactions with Bank Ledger transactions using a 25+ exhaustive rule engine. Bank Statement data is usually available in PDFs. The tool incorporates an OCR based engine to convert the statement PDFs to excel or other tabular data formats. Designed a Tableau dashboard as part of the deliverable output.
The tool had secured an international level development funding under the EY Lighthouse project award as the winning entry from the EMEIA region. The tool was successfully implemented on bank data of more than 120 clients covering about 1400 bank accounts.
Apr 20 - Aug 21
Spearheaded in developing and designing the skew remover tool targeting the skewed data present in datasets.
Devised advance analytical logic using Alteryx’s automation that increased the efficiency and accuracy of removing skew.
Jul 18 - Apr 19
An Augmented reality based project for Builders to Showcase their Portfolios in a more appealing form using Markerless technology. This helps common person to understand under construction building details in notable way.
Jul 18
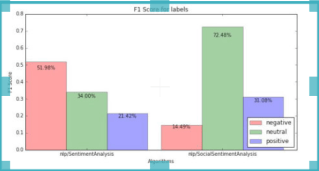
The Project uses tweets from President of various countries and analyses each tweet for the sentiments ,words used for the specific country from the tweet to calculate the negative and positive relations between them.
Nov 16 – Feb 17
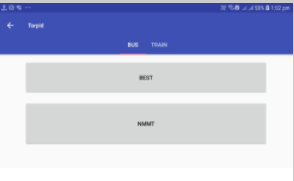
An Android Application for BEST Commuters replacing Printed Tickets with Paperless tickets which can be downloaded on the phone through the application
Apr 17
Created a website that provides information to the user of destinations around the world known for the scenic beauty, tradition and nature using HTML5, CSS, PHP and JavaScript.
1: Python
2: Java
3: R
4: C++
5: C
6: MySQL
7: SQL
8: HQL
1: Numpy
2: Pandas
3: NLTK
4: Scikit
5: Matplot
6: Math
7: Pytorch
8: Tensorflow
9: React
1: Anaconda
2: Jupyter
3: Tableau
4: Alteryx
5: Power BI
6: Unity 3D
7: Vuforia
8: Blender
9: Android Studio
10: Flask
1: HTML
2: CSS
3: Javascript
4: PHP
5: D3.js
Ernst and Young [EMEIA level (Europe, middle East, india and Africa )]
Received an international level development funding for DigiBRAT (Digital Bank reconciliation and Anomaly detection Tool) as the winning solution from the EMEIA region. The tool reconciles bank transactions in a company's bank statement to the transactions in its bank ledger
20 April 2019
20 April 2019
23 February 2019
.
Created with Mobirise - Try here